[First published in issue no. 5 of Intransigence (now defunct), a journal of Internationalist Communists in North America, on October of 2019.]
The ripest maturity, the highest stage, that anything can attain is the one at which its fall begins.
Hegel, The Science of Logic 1
The concept of decadence remains a source of controversy for Marxists. Those who reject it oftentimes do so because they have come to associate that idea with a position of resigned fatalism positing the automatic collapse of capitalism as a consequence of the mechanical operation of abstract “laws of history,” without any need whatsoever for conscious human intervention. Ironically, this interpretation is shared both by deniers of decadence and the economistic tendencies within Marxism. For that reason, it becomes necessary to clarify our position from the outset that the mortal crisis of capitalism will not result from any breakdown tendency inherent in the system but will instead depend entirely upon the degree of class consciousness and independent self-organization achieved by the working class. In other words, the concept of decadence is not a pretext for us to turn humankind into a marionette of the capitalist economy. It is rather a tool – an analytic construct – that allows us to better understand the historical evolution and progressively-strained operation of a given mode of production.
Numerous theories have attempted to explain the phenomenon of decadence, far too many to do each of them justice in this short text. So, we shall have to be somewhat restrained in our exposition. For our purposes, however, they can all be collapsed into one of two categories: historical-philosophical and economic-technical explanations.
From a historical-philosophical standpoint, a social order outlives its purpose – i.e., it becomes decadent – from the moment that it brings into existence the material preconditions for its own transcendence. From this perspective, every social order that exists or has existed to date carries within itself the possibility of its own undoing in the antagonistic struggle between social classes for control over society’s productive forces.
The ‘proof’ of capitalism’s decadence is therefore given by the working class as well as its antagonist: the capitalist class. The working class gave its definitive proof when – in 1917 – it called forth an international revolutionary movement to abolish capitalism. The historical mission of capitalism was to spread its relations of production to every distant corner of the world and develop humanity’s productive forces sufficiently to establish a global communist society. The most important of these productive forces – the working class – has repeatedly shown its communist potential by rebelling against the rule of capital. The capitalist class, for its part, gave proof of the decadence of its society over the last century by plunging humankind in two bloody world wars and since then a slew of smaller armed conflicts, whose human costs are calculated in the hundreds of millions – sacrificial lambs on the altar of capitalist profit. To top it all off, capitalism has produced thermonuclear and biochemical weapons capable of exterminating the entire species in mere minutes and continues to inflict irreversible damage on the biosphere.2 These are all the hallmarks of a society that is long past its proverbial ‘sell-by’ date.
The economic-technical explanation for the decadence of capitalism follows from the theory of crisis based on the falling rate of profit articulated by Marx in the third volume of Capital. The tendency of the rate of profit to fall derives logically from the application of the labor theory of value (henceforth, LTV) that Marx inherited from classical political economy to the process of capital accumulation. According to the LTV, the exchange-value of a commodity can be linearly determined from the amount of time required, on average, for its production. From the LTV, we get Marx’s formula of capital reproduction: c + v + s, where c represents constant capital, or means of production; v represents variable capital, or living labor-power; and s represents surplus-value, or the value generated by workers in excess of their own wages over the course of the working day.3 In more traditional economics parlance, constant capital would refer to fixed assets, variable capital refers to wages, and surplus-value refers to value added. From Marx’s formula of capital reproduction, we derive the following formulae:
1. The rate of exploitation (henceforth, ROE);


2. The rate of profit (henceforth, ROP);


3. And the organic composition of capital (henceforth, OCC).


Social needs are satisfied indirectly under capitalism. The goal of production is to make profits for the owners of capital. The laws of competition compel capitalists to increase the scale of their operations in order to keep apace with their rivals on the market. The incessant growth of the means of production (i.e., the physical capital stock) for its own sake, to which we shall refer from here on as ‘capital accumulation’, causes the OCC to rise by increasing the proportion of constant to variable capital.4 The inevitable outcome of this process is that a shrinking number of workers must generate enough surplus-value to maintain and expand an ever-larger mass of capital.5
Capital accumulation benefits capitalists in the short term. A rise in the OCC yields higher labor-productivity, which allows for the same quantity of goods to be produced within a shorter length of time. This translates into lower costs of production per unit, because it means that a somewhat bigger investment will be spread over a much-increased output. The difference between average social production costs and the new, lowered costs owing to the higher OCC returns to the capitalist entrepreneur as additional surplus-value. These changes in the ratio of capital investments, or value composition of capital, are automatically reflected in a higher ROE and ROP.6
But since every business follows similar imperatives, and therefore behaves according to the same logic, this means that, given enough time, the higher OCC will be adopted as a standard within that industry. This creates a problem for capitalists, because, in keeping with the LTV, the increase in labor-productivity that accompanies a rising OCC necessarily reduces the exchange-value of the commodities produced and thus the amount of surplus-value available for capital accumulation. A contradiction thereby arises between the growing mass of capital, whose expansion requirements become increasingly burdensome to profit-making, and the shrinking mass of surplus-value that would serve to finance its expansion.7 This contradiction — inherent in capitalist production — manifests itself via the tendency for the rate of profit to fall. We demonstrate this mathematically as follows:
Let the c and v invested in its production both be 64, so that the OCC is:

The exchange-value of those commodities would break down as follows:
64c + 64v + 64s = 192
The ROE would be:

And the ROP would be:


Let the scale of production and the total output both expand two-fold. Assuming the constant capital grows at twice the rate as the variable capital, that would make the new OCC:


In that case, the exchange-value of those commodities would break down as follows:
384 = 128c + 96v + 160s
Or, for half of the output:
192 = 64c + 48v + 80s
That would make the ROE:

And the ROP:

Now, if the same output can be produced in two-thirds the amount of time as before, then it follows, per the LTV, that its value will also diminish by one third once the higher OCC becomes standard within that industry, which would make the value of those commodities come to 144.8
Under those circumstances, the breakdown of the exchange-value of those commodities would be:
64c+ 48v+ 32s = 144
The ROE under the new generalized OCC would be:

And the ROP would be:


As the example above shows, even under normal conditions of capital accumulation, the rate of profit must fall. In the short term, the declining profit rate may be partially compensated by the growth, in absolute terms, of the total mass of profits and the rising rate of exploitation, as we have just seen.9 Invariably, however, a point will be reached at which the maximum amount of surplus-value that could be extracted from a diminished working class will prove insufficient to expand the capital which has already been accumulated and production will need to be scaled back accordingly. Thus, “[t]he true barrier to capitalist production”, turns out to be, “capital itself”.10
There are, however, countertendencies to the falling rate of profit which may dampen its effects, or even defer them temporarily, although they are unable to nullify them in the long run.11 The first of these, the rise in the rate of exploitation, we have already mentioned, but it is worth expanding upon it a bit more. Capitalists have essentially two strategies at their disposal to raise the rate of exploitation: increasing the productivity of labor and pushing wages below their value, as determined by the reproduction costs of the workforce.12 A great deal of time has been devoted in this piece to discussing the first of these, because it is so crucial to the capital accumulation process, but the second is no less important. Indeed, it would be impossible for us to make any sense of austerity measures and similar policy changes put into place by capitalist governments the whole world over without first situating them in the historical context of capitalism’s impaired ability to generate profit. Austerity measures can contribute to raising the rate of exploitation by slashing public-sector expenditures and obligations, more specifically social supports that disproportionately benefit the working class, and which are largely financed out the profits generated by the private sector of the economy. Austerity is essentially decadent capitalism’s attempt to make the working class pay for the crisis of overaccumulation by redistributing surplus-value upwards.
The third countertendency to the falling rate of profit is the cheapening of the elements of constant capital relative to the total mass of profits. The OCC is a superb measure of this because it is at once a technical composition of capital (i.e., a ratio of machines to workers) and a value composition of capital (i.e., a ratio of capital investments), so it is extremely sensitive to such changes. If the value of the constant capital declines, then the OCC will reflect this. Instead, what we see upon examination of the empirical data is a gradual rise in the OCC over time, with some devaluation after major crises, and, of course, massive de-capitalization in the 1980s due to offshoring. How do we explain this pattern? Both the ROP and OCC undergo cycles of growth and contraction, even if they trend in a specific direction in the long run, but those cycles differ greatly in length and are out of lockstep with one another (see Table 1). This is not really an inconvenient finding for us, as it conforms perfectly to Marx’s theory. Recall that in the short term, a rising OCC need not decrease the ROP at all. In fact, the ROP can even increase, provided the ROE grows quickly enough. It is only in the long run that a rising OCC causes the ROP to fall.
Table 1. Mean number of years between troughs, peaks, and from trough to peak for the years 1960-2017.
| Time Series | Trough to Trough | Peak to Peak | Trough to Peak |
| Organic Composition of Capital | 9.20 | 12.25 | 6.11 |
| Rate of Profit | 6.86 | 6.71 | 3.4 |
The fourth countertendency to the falling rate of profit is relative overpopulation and the growth of the industrial reserve army. The term ‘industrial reserve army’ has traditionally been used to refer to that subset of the working class which experiences unemployment on a semi-permanent basis or is otherwise subject to de facto exclusion from the workforce, as has been the case for members of racial/ethnic minorities in the United States and other countries. Yet, it may be worth updating this definition somewhat in light of the proliferation of precarious work arrangements and the relocation of industries employing large numbers of workers in the developed world to low-wage – typically underdeveloped – countries. The official unemployment rates made available by government fact-finding agencies capture only a part of the full picture. A more accurate estimate of the unemployment rate would include those whose attachment to the labor market may be described as marginal at best, as well as the many others who have been cut back to part-time for economic reasons. Data incorporating these populations are scarce, only going as far back as the mid-1990s, so we are naturally limited in the conclusions that we can draw. The basic logic, however, is that if the ROP falls, then the capitalist class as a whole will not be able to employ the same number of workers as before, so naturally unemployment would go up. Likewise, a rising OCC is associated with a gradual displacement of the workforce and a growing industrial reserve army due to the increasing capital-intensiveness of production. Competition for employment increases as well, causing wages to fall. However, any rise in profitability resulting from this is quickly offset by the creation of less well-paid positions in the logistical and service industries to transport and sell off the expanded output generated by the private sector of the economy. Instead of mass unemployment and angry mobs of destitute people roaming the streets, with all of the political consequences that this would likely have, we get an expansion of the tertiary – i.e., service – sector of the economy relative to industries such as manufacturing that produce material goods.
The fifth countertendency to the falling rate of profit is the rise of foreign trade as a proportion of national income. Foreign trade helps compensate for the declining profit rate by providing capitalists with cheap inputs of raw materials and labor-power otherwise unavailable in their home countries. By reducing capitalists’ production costs, foreign trade increases the proportion of the commodities’ exchange-value that consists of surplus-value. Moreover, by reducing the value of the constant capital in relation to its variable component, foreign trade curbs the growth of the OCC, forestalling the fall in the ROP. It might be helpful to illustrate this using an example:
Let the exchange-value of a whole mass of commodities be equal to 192.
Let the c and v invested in its production both be 64, so that the OCC is:
The exchange-value of those commodities would break down as follows:
64c + 64v + 64s = 192
The ROE would be:
And the ROP would be:
Let the value of the c and v invested in production fall by a quarter, so that the exchange-value of those commodities breaks down as follows:
48c + 48v + 96s = 192
In that case, the OCC would still be:

But the ROE would be:

And the ROP would be:


Besides this, foreign trade supplies capitalists with new export markets unto which they can dump all of their excess output (i.e., whatever domestic markets are unable to absorb). Its positive effect on the ROP is, however, limited to the short term, tapering off over time. The higher demand for labor-power that results from exporting production to low-wage regions increases workers’ bargaining power relative to employers, which causes wages to rise. So, the class struggle is what accounts for the global rise in living standards in the past few decades (paltry as it has been by comparison to the developed world), much of which has been limited to two countries: China and India. Simply put, there is no mechanism inherent to capitalism that would automatically raise living standards for working people. The labor costs that workers can impose on their employers depend entirely on their ability to organize in order to press demands collectively and what the latter can actually concede, since naturally wages cannot exceed profits. In any case, rising wages for workers in the developing world present a problem for capitalism as a whole because it removes one possible solution to the falling ROP off the table, so to speak.
The sixth and final countertendency to the declining profit rate is the growth of financial (or interest-bearing) capital relative to the total output of the capitalist economy. Financial capital has always played a role complementary to capitalist production by shortening the turnover time of capital – i.e., the duration of time between production of goods and the realization of surplus-value.13 By extending to businesses a line of credit, financial capital enables them to continue paying employees and buy the raw materials necessary to keep up production while their goods are in circulation; in exchange, of course, for a percentage of the profits thereby generated. Financial capital consists, then, of a claim on future income, regardless of whether that income takes the form of rent, profit, or wages.14 Now, these claims may be held individually by a bank, credit union, or other lending institution, or they may be bundled up with other such claims and resold to investors as speculative assets. The creation and buying up/selling of debt are at the heart of the national and global financial system. However, financial capital becomes all-important for the maintenance of capitalist profits in capitalism’s decadent phase. As profitable investment opportunities in the productive sphere become scarce, for the reasons that we have discussed, money-capital is increasingly diverted towards speculation in the financial sector of the economy.
Multivariate regression provides us with a means by which to empirically test Marx’s theory of crisis based on the falling rate of profit. Regression analysis measures the change in the outcome variable for every unit-increase in the predictor variable(s).15 If Marx’s theory is true, then we would expect there to be a negative relationship between the ROP and OCC – i.e., a rise in the OCC is associated with a decline in the ROP and vice-versa. In other words, we are testing a null hypothesis (H0) of no or positive association between the ROP and OCC against an alternative hypothesis (H1) of negative association between the ROP and OCC. We perform two types of regression analysis to test this relationship, using proxy variables for the countertendencies to the falling ROP.16 The bivariate model tests the association between the ROP and OCC alone, while the full model controls for the effect of countertendencies. The results of the analyses in Tables 2 and 3 confirm our alternative hypothesis.17
Table 2. Predictors of rate of profit changes for the US private sector for the years 1960-2017.
| Predictors | Bivariate Model | Full Model |
| Organic Composition of Capital | -0.0354** | -0.0114*** |
| Rate of Exploitation | 0.2333*** | |
| Average Household Debt | 0.0457 | |
| Rate of Accumulation | 0.0009 | |
| Unemployment Rate | 0.0272 | |
| Foreign Trade to GDP | -0.0219 | |
| Financial Assets to GDP | 0.0026 | |
| Government Spending to GDP | -0.0244 | |
| Prob > Chi2 | 0.0065 | 0.0000 |
| Number of Observations | 56 | 53 |
ARIMA (0,2,0) regression coefficients shown. * p < 0.05. ** p < 0.01. *** p < 0.001. More stars indicate greater statistical significance.
The results of ARIMA regression in Table 2 can be interpreted as follows: for the bivariate model, a single unit-increase (percentage) in the OCC is associated with 0.0195 of a percent reduction, on average, in the ROP; for the full model, a single unit-increase in the OCC is associated with a 0.0108 of a percent reduction, on average, in the ROP, holding countertendencies constant.18 The robust regression results in Table 3 can be interpreted thusly: for the bivariate model, the relationship between ROP and OCC appears statistically non-significant, but since the ROP is positively correlated with itself in the previous year, it is likely that the effect of the OCC on the ROP is being subsumed into the autocorrelation; for the full model, a single unit-increase in the OCC is associated with a 0.0146 of a percent reduction, on average, in the ROP, holding constant the effect of countertendencies.19
Table 3. Predictors of rate of profit changes for the US private sector for the years 1960-2017.
| Predictors | Bivariate Model | Full Model |
| Rate of Profit (t-1) | 0.8476*** | .0387* |
| Organic Composition of Capital | -0.0036 | -.0146*** |
| Rate of Exploitation | 0.2330*** | |
| Average Household Debt | 0.0136 | |
| Rate of Accumulation | 0.0042 | |
| Unemployment Rate | 0.027 | |
| Foreign Trade to GDP | -.0628*** | |
| Financial Assets to GDP | -0.0027 | |
| Government Spending to GDP | -0.0017 | |
| Prob > F | 0.0015 | 0.0000 |
| Number of Observations | 58 | 54 |
Robust regression coefficients shown. * p < 0.05. ** p < 0.01. *** p < 0.001. More stars indicate greater statistical significance.
The phenomena that we call crises are nothing more than periodic disruptions in the process of capital accumulation due to the absolute overaccumulation of capital.20 Of course, every new crisis differs from the previous one. They each have their geneses in a combination of factors, which, because they are not entirely knowable, also make it impossible to predict them ahead of time. What each crisis has in common, though, is that its origin can be traced back unfailingly to the internal dysfunctionality of capitalistically organized production.21
The decline in the rate of profit is a fairly well-documented phenomenon, although economists outside of the Marxist tradition have always been perplexed by it, attributing its persistence to forces supposedly “outside” of capitalism, such as government regulation, wars, famines, and environmental disasters. This should not surprise us in the slightest, since they generally dismiss the LTV and all the theoretical conclusions drawn from it as an atavism of classical political economy. Nevertheless, the empirical data are unmistakably clear: the rate of profit has fallen. It is not a linear tendency – there are peaks and troughs – but the long-term trend indicates a decline.22
Figure 1. US Private-Sector Rate of Profit with Lowess trendline for the years 1960-2017.

Even though the falling rate of profit is accepted by economists and ideologues of all stripes as an incontestable fact, its root cause remains the object of much debate. Here, too, the empirical data lend support to the Marxist thesis, which posits that crises stem from the irreconcilable contradiction between the inflated mass of capital and the surplus-value available for accumulation. Figure 2 below illustrates that the decline in the rate of profit for the period of 1960-2017 is (roughly) inversely proportional to the rise in the organic composition of capital.
Figure 2. US Rate of Profit by the Organic Composition of Capital for the years 1960-2017.
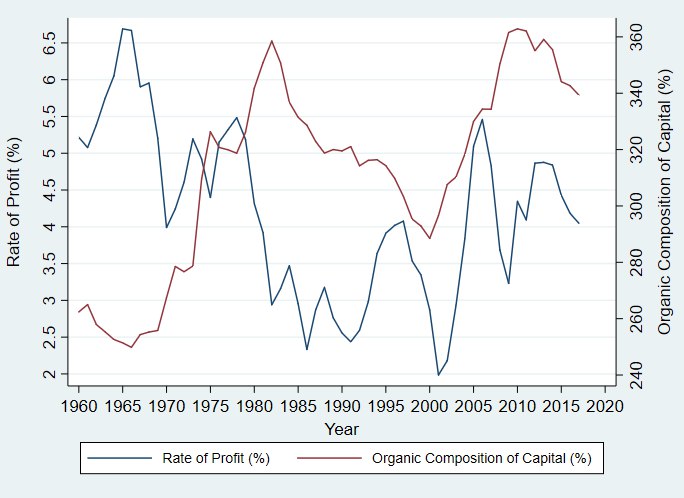
This observation is entirely consistent with the explanation for crises we outlined earlier. To reiterate, at a certain point in the capital accumulation process, the mass of capital grows too large in relation to the available surplus-value. Its expansion requirements become insurmountable as a consequence, and a crisis ensues. The crisis mechanism restores profitability to production by forcing capitalists to liquidate – i.e., sell off – their unused capital and get rid of excess workers, which has the net effect of reducing both capital investment and labor costs in the short term. This raises the rate of profit to a level acceptable for capital accumulation to begin once more.
Because, however, the accumulated capital is larger than it was previously, the amount of profits that will have be generated to expand it are also greater each time that the cycle restarts. Eventually, the mass of capital will grow large enough that crises on their own no longer restore profitability, or the length of time for which they would have to drag on becomes unacceptable to those in power. This prompts the State to intervene in the economy on behalf of capitalists, although not necessarily on their terms. One of the chief means by which governments typically do so is through “pump-priming”, which involves injecting money into the economy to stimulate growth.23 For that reason, the role of the State in the economic sphere has expanded significantly in the second half of the twentieth century, coinciding with the decline in the ROP, as can be seen from Figure 3 below.
Figure 3. US Government Spending as % of GDP by the Rate of Profit for the years 1960-2017.

Indeed, total government spending as a percentage of GDP has averaged 31% in the US since the end of the Second World War, meaning that the State effectively controls a third of the economy. Even though the US government does not dictate output quotas to private capitalists, it is nevertheless engaged in a form of quasi-planning through the subsidization of production by deficit financing.24 Yet, the periodic collapse of the capitalist economy cannot be prevented through state-facilitated accumulation alone; at best, it can be deferred. For the government has, properly speaking, no money of its own. The money that it spends is obtained by taxing the profits extorted from the working class by private capitalists or is otherwise borrowed against future tax revenues. Even in the latter case, that money has to be paid back with interest, which further depresses the rate of profit.25 But the State cannot borrow money to prop up an ailing economy forever. The gravy train will eventually arrive at its final stop. In that case, there will only be one solution for the capitalist system as a whole: the destruction of capital values on a scale possible only through imperialist war. By destroying a portion of the accumulated capital, its expansion requirements can be lowered sufficiently for production to resume. This would be functionally the same as reverting to an earlier stage of capital accumulation.26 It should go without saying that states do not go to war with one another with the aim of reducing their own industry to rubble. Instead, they do so for typical capitalist reasons: gaining access to new markets and inputs. Regardless of the actual motive, wars make possible a new round of accumulation by lowering the expansion requirements of the accumulated capital.27
This means that all subsequent accumulation under decadent capitalism is fated to end in imperialist barbarism – i.e., in war. By imperialism, we are not referring to an aggressive foreign policy that states can adopt or abandon at will; nor do we mean the predation by powerful states upon weaker ones. Imperialism is rather a new stage in the global operation of the capitalist mode of production. It is the stage reached by capitalism when the OCC is so high in the industrialized countries that the only way to ameliorate the decline in the ROP is to seek out new sources of raw materials and labor-power in the underdeveloped world.28 In other words, imperialism is the militaristic expression of the economic competition among various capitals. What underlies imperialism, then, is a conflict among capitalists to capture for themselves a larger share of the global pool of surplus-value generated by the world working class. Military spending appears unproductive from capitalists’ vantage point – a deduction from the total profit. This is far from the case, however. For although military spending and the wars that it makes possible are funded by private-sector profits, the returns it yields for the capitalist economy are considerable.
As before, we use multiple regression analysis to see whether this explanation holds up empirically. Here, we test a null hypothesis (H0) of no or negative association between US defense spending and the OCC against an alternative hypothesis (H1) of positive association between US defense spending and the OCC, including as controls the ROP, ROE, foreign trade as a percentage of GDP and financial assets as a percentage of GDP.
Table 4. Predictors in changes to US Defense Spending for the years 1960-2017.
| Predictors | Bivariate Model | Full Model |
| US Defense Spending (t-1) | 0.9911*** | 0.9047*** |
| Organic Composition of Capital | 0.1435* | 1.4351*** |
| Rate of Profit | 90.6755*** | |
| Rate of Exploitation | -22.1303*** | |
| Foreign Trade to GDP | 4.5005* | |
| Financial Assets to GDP | 0.4724** | |
| Prob > F | 0.0000 | 0.0000 |
| Number of Observations | 57 | 54 |
Robust regression coefficients shown. * p < 0.05. ** p < 0.01. *** p < 0.001. More stars indicate greater statistical significance.
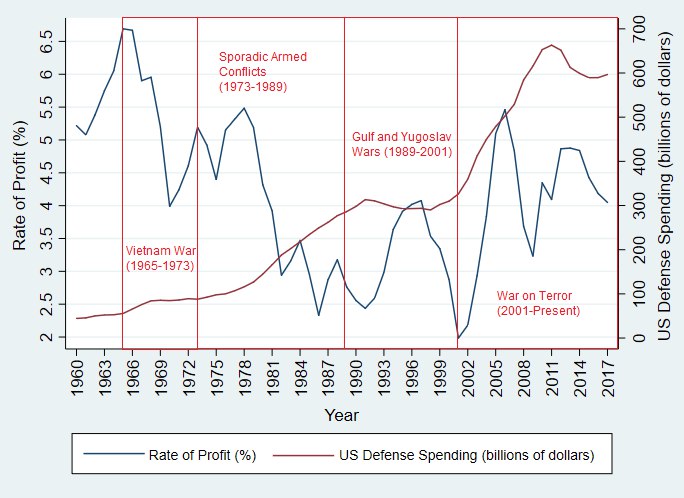
The results of robust regression in Table 4 seem to confirm our alternative hypothesis. They can be interpreted as follows: for the bivariate model, a single unit-increase (percentage) in the OCC is associated with a 140 million dollar increase, on average, in US defense spending; for the full model, a single unit-increase in the OCC is associated with a 1.435 billion dollar increase, on average, in US defense spending, all else being the same. In the same model, it can also be seen that for every unit-increase (percentage) in the ROP there is a corresponding increase of 90 billion dollars, on average, in US defense spending, net of all the other variables included in the model. This is consistent with our earlier claim that imperialism – measured using US defense spending as a proxy variable – helps maintain the profitability of the private sector.29 Further, the positive association between US defense spending and the ratio of foreign trade and financial assets to GDP supports our argument that imperialism is vital in securing access to foreign export markets and new spheres for financial investment.
Figure 4. US Defense Spending by the Rate of Profit for the years 1960-2017.
It is thus that we should understand all conflicts between different factions of the capitalist class, including so-called movements for national liberation. These had an historically progressive character earlier in capitalism’s history because they helped consolidate capitalism as an economic system by clearing out the remains of past modes of production, in the process creating a world working class in whose interests it would be to abolish class society. With the onset of capitalist decadence, this function of independence movements has been completely superseded. In the age of imperialist decay, independence movements are no longer progressive but have become incorporated into the struggle for profits between competing factions of capital.30 Therefore, the working class no longer has anything to gain from supporting them. In the last century, communists gave support to independence movements following the rationale that they would weaken the hold of imperialism in the colonies and prepare workers for the contestation of political power, but this has never once happened. Instead, these movements merely shifted the center of gravity within a region from one imperialist power to another competing power.
In summation, the accumulation of capital, once progressive, has completely outlived its historic purpose. Instead of laying the groundwork for a global human community without states, exploitation, or wars, it can only undo the acquired social development by dragging humankind towards disaster in the form of war, economic collapse, and ecological catastrophe. More than a hundred years ago, Rosa Luxemburg wrote that humanity was being presented with a stark choice between socialism and barbarism.31 Two decades into the twenty-first century, we are long past the point where barbarism – i.e., the collapse of mass civilization – is our worst-case scenario. Instead, the realistic choice before us today is between communism and extinction. The survival of our species is too important to leave in the hands of the social parasites who command our lives and labor. No progressive faction of capital can exist today because the capitalist class as a whole is materially invested in the preservation of a social order that is no longer capable of contributing to the wellbeing of humanity. Consequently, any strategy that calls on us to make a common front with our enemy, even if temporarily, cannot fail to have disastrous consequences. We must look, instead, to the working class as the engine of social transformation. Though it will surely strike some people as doctrinaire, only the working class, a class whose self-emancipation simultaneously does away with all other oppressions, has an immediate interest in abolishing capitalism and founding a new social order (communism) in its place.32 Its arrival on the stage of history as a conscious political force is necessary – today more than ever – to move beyond the impasse of capitalist decadence and avoid an apocalyptic future.
ES
1 George Wilhelm Friedrich Hegel, The Science of Logic (Cambridge: Cambridge University Press, 2010), 539.
2 Grandizo Munis, “Impossibility of Capitalist Development,” published in Alarma issue nos. 23-24, organ of F.O.R (Fomento Obrero Revolucionario/Workers’ Revolutionary Ferment). First translated into English and re-published in the inaugural issue of Intransigence.
3 Karl Marx, Capital vol. 1 (London: Penguin Classics, 1990), 320.
4 Ibid., 739.
5 Paul Mattick, Economic Crisis and Crisis Theory (London: Merlin Press, 1981), 53-54.
6 Marx, op. cit., 432-435.
7 Karl Marx, Capital vol. 3 (London: Penguin Classics, 1990), 317-319.
8 It is impossible to say with absolute certainty how much productivity will increase simply by adding more machines to production – i.e., by increasing investment in c relative to v. The OCC varies significantly among firms; it also develops unevenly across industries, even within the same country. I have imputed productivity growth from the percentage increase to the OCC. I justify this on the basis that all of these differences should disappear in the aggregate when analyzing the US, or even world, economy as a single capital.
9 Paul Mattick, Marx and Keynes: The Limits of the Mixed Economy (Boston: Porter Sargent Publishers, 1969), 63-65.
10 Ibid., 358.
11 Marx, op. cit., 339-348.
12 Karl Marx, Capital vol. 1 (London: Penguin Classics, 1990), 645.
13 Karl Marx, Capital vol. 2 (London: Penguin Classics, 1990), 233.
14 Karl Marx, Capital vol. 3 (London: Penguin Classics, 1990), 471.
15 Regression models are essentially a-theoretical, insofar as they do not posit a specific relation among variables. They make certain assumptions about the shape of the distribution, the distribution of the errors (residuals), the consistency of central tendencies such as the mean across time, the instance-independence of observations, etc. Real-life distributions violate these assumptions a majority of the time. However, there are regression models which are robust against violations of these assumptions. Moreover, it is possible to ‘fit’ a model in such a way that the true nature of the association among the predictor and outcome variable(s) can be determined.
16 ARIMA (autoregressive integrated moving-average) regression is a statistical model used in analyzing and forecasting time-series data. An ARIMA models consists of three components, or parameters: an autoregressive component specifying that the outcome variable is a linear function of its current and past value(s); an integrated component that subtracts, or differences, an observation’s current value from its past value(s) to make the data stationary – i.e., the mean and variance are consistent across time – and remove trends; and, finally, a moving-average component specifying that the outcome variable is a linear function of its current and past error(s). Thus, ARIMA models are typically denoted as ARIMA (p, d, q), where p is the number of lagged observations, or lag order; d is the differencing order, or times that observations are differenced; and q is the size of the moving-average window, or moving-average order.
The (non-)stationarity of a time series can be determined via the Dickey-Fuller Test (DFT). The DFT tests a null hypothesis (H0) that the outcome variable contains a unit-root, in which case it is not generated by a stationary process, against an alternative hypothesis (H1) that the process generating the data is stationary. Results of the DFT indicate first- and second-order differencing to be plausible.
Table A. Dickey-Fuller Test results: US Rate of Profit for the years 1960-2017.
| Order of Differencing | t-statistic | Number of Observations | p-value | |
| 0 | -1.93 | 57 | 0.3179 | |
| 1 | -5.401 | 56 | 0.0000*** | |
| 2 | -9.251 | 55 | 0.0000*** |
* p < 0.05. ** p < 0.01. *** p < 0.001. More stars indicate greater statistical significance.
The lag order (p) and size of the moving-average window (q) can be determined through the autocorrelation and partial auto-correlation functions (ACF and PACF, respectively), as per the Box-Jenkins method. The ACF provides the correlation between an observation and its past value(s), while the PACF provides the correlation between an observation and past value(s), excluding all values in between the two. AC and PAC plots measure the statistical significance of autocorrelations and partial autocorrelations. Lagged correlations outside of the 95% confidence band are statistically significant at the p < 0.05 threshold – i.e., there is a 5% likelihood of obtaining that result if the null hypothesis (H0) were true. A statistically significant autocorrelation or partial autocorrelation at n lag indicates that n be considered for the lag and moving-average order(s). For reference, see the summary of goodness of fit statistics for different plausible models on Table B. We show AC and PAC plots for the rate of profit with first- and second- order differencing below (Figs. A & B).
Figure A. Correlation and Partial Autocorrelation plots for the Rate of Profit with first-order differencing.
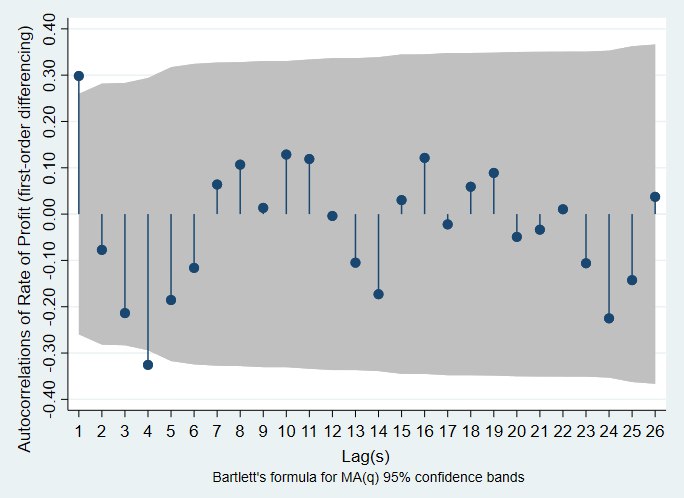

Figure B. Correlation and Partial Autocorrelation plots for the Rate of Profit with second-order differencing.


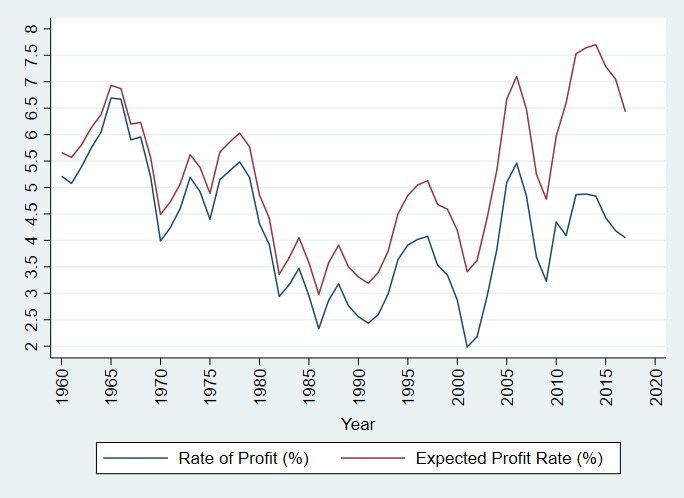
As an additional test of the robustness of my model, I have produced a forecast of the ROP for the time-period under examination (1960-2017) using the coefficients from the ARIMA (0,2,0) model in my article and the mean ROP for that same time-period as the intercept, or constant. My model, like all others, is far from perfect; it slightly overshoots the ROP, especially in the later years. However, it is generally successful at replicating the data points. I include a graph of the expected and actual profit rates for the years 1960-2017 below:
Figure C. Expected and Actual Rates of Profit for the US Private Sector for the years 1960-2017.
The prediction equation for the regression model above, which I used to forecast profit rates for the years 1960-2017, is as follows:
ROPt = β0 + β1OCCt+ β2ROEt + β3AHDt + β4ROAt + β5UNMRt + β6FT2GDPt + β7FA2GDPt + β8GS2GDPt + [(ROPt – ROPt-1) – (ROPt-1 – ROPt-2)] + εt
The current year’s profit rate – ROPt – is the outcome. Beta naught (β0) is the intercept: the value of ROPt when all other variables are set to zero. As before, OCCt and ROEt are the organic composition of capital and rate of exploitation in a given year. AHDt is average household debt, which proxies for the total wage packet paid out to the working class. ROA is the rate of accumulation, computed by dividing gross fixed capital formation by net fixed assets and measures the value of constant capital. UNMRt is the official unemployment rate, which is proxying for the industrial reserve army. FT2GDPt is foreign trade as a percentage of GDP, which is measuring the dependence of profits on foreign markets. FA2GDPt is the ratio of financial assets to GDP, which measures the financialization of the economy. GS2GDPt is government spending as a percentage of GDP, which attempts to get at the size and role of the State in the economy. The formula (ROPt – ROPt-1) – (ROPt-1 – ROPt-2) stands for second-order differencing (i.e., the change in the changes). Finally, εt is the residual – or error – term for the current year; it ideally captures all the ‘white noise’ in the time series.
17 The results with which we are concerned with here are the statistical significance of our regression coefficients, as determined by the p-values of said results. P-values tell us the likelihood that a result would be obtained if the null hypothesis (H0) were true.
18 Although the ACF and PACF both seemed to indicate the data-generating process is ARIMA (4,2,0), it is generally considered best-practice to try out other plausible models in order to avoid errors resulting from misspecification. The Akaike and Bayesian information criteria (AIC and BIC respectively) are post-estimation analyses used to determine the best-fitting among several possible models. In this case, the ‘best-fitting’ model is the one that best explains our data while minimizing model complexity. In other words, overparametrization – i.e., overfitting – is penalized and parsimony is rewarded. As such, a smaller AIC and BIC implies a better-fitting model. The results of postestimation analyses in Table B seem to suggest that ARIMA (0,2,0) is the best-fitting model for my data.
Table B. Goodness of Fit Statistics for ARIMA models.
| Model | Log Likelihood | AIC | BIC | Regression Coefficient |
| ARIMA (0,2,0) | 69.89411 | -119.7882 | -100.0853 | -0.0114*** |
| ARIMA (4,2,0) | 78.1835 | -128.3670 | -100.7829 | -0.0099*** |
| ARIMA (3,1,0) | 86.4176 | -146.8352 | -120.9785 | -0.0108*** |
| ARIMA (2,1,0) | 86.3414 | -148.6828 | -124.8150 | -0.0108*** |
| ARIMA (1,1,0) | 85.7214 | -149.4429 | -127.5640 | -0.0108*** |
| ARIMA (0,1,0) | 85.5114 | -151.0227 | -131.1329 | -0.0108*** |
| ARIMA (1,1,1) | 88.8346 | -153.6692 | -129.8013 | -0.0114*** |
ARIMA regression coefficients shown. * p < 0.05. ** p < 0.01. *** p < 0.001. More stars indicate greater statistical significance.
19 Since I only had data on the US and the rate of profit is susceptible to external ‘shocks’, I used robust regression, an offshoot of ordinary least squares (OLS) regression which downweighs the influence of outliers, to hedge against extreme observations.
20 Ibid., 359-360.
21 Michael Roberts, The Long Depression (Chicago: Haymarket Books, 2016), 26.
22 All the data were obtained from the Federal Reserve Economic Data (FRED). I computed the rate of profit by dividing non-financial corporate profits by net fixed assets plus employee compensation. The organic composition of capital was computed by dividing net fixed assets by employee compensation. The rate of exploitation was obtained by dividing non-financial corporate profits by employee compensation. The rate of accumulation was obtained by dividing gross fixed capital formation by net fixed assets. Finally, I calculated average household debt by dividing household consumer debt by the total households in the US. I use average household debt in my analysis as a proxy measure for workers’ wages and social supports, which are complementary to the wage packet. My reasoning for doing so is that if wages fall below the amount needed for workers to afford the basic necessities of life, as determined by their social and cultural context, then that shortfall will have to be made up by a rise in household consumer debt. The dataset that I used to make all of my charts and tables and run my analyses for can be downloaded freely here. I labor on the assumption that prices closely follow – if not directly mirror – the value of inputs. I argue that this assumption is justified when working from data on the level of a whole country, particularly a country that is as centrally-positioned within the world economy as is the US, because while there are differences across firms and industries, these tend to break down in the aggregate and prices should theoretically approximate exchange-values.
23 Mattick, op. cit., 136-137.
24 Mainstream – i.e., bourgeois – economists will retort that the ratio of total government spending to GDP does not actually mean that the US government controls such a percentage of the economy, since most of the money generated via taxation is spent on goods produced in the private sector. Of course, this is an elision of the main argument being made here, which is that, under the conditions of capitalist decadence, governments increasingly see themselves obligated to assume the basic functions associated with private capitalists. In specific, they use taxation as a means to redistribute profits and steer production and capital investments towards certain sectors.
25 Paul Mattick, Economic Crisis and Crisis Theory (London: Merlin Press, 1981), 117-118.
26 Henryk Grossman, The Law of Accumulation and the Breakdown of the Capitalist System (London: Pluto Press, 1992), 156-157.
27 Internationalist Communist Tendency (ICT), “The Economic Role of War in Capitalism’s Decadent Phase,” published in Revolutionary Perspectives issue no. 37.
28 Internationalist Communist Tendency (ICT), “The Fall in the Average Rate of Profit – the Crisis and its Consequences,” published in Revolutionary Perspectives issue no. 52.
29 Strictly speaking, it is not possible to infer a causal relationship between US defense spending and the rate of profit from the regression on Table 4. Nevertheless, I ran a separate model which confirmed my earlier claims about imperialism. In the interest of simplicity, I have opted not to include a table of these results in the main text, but I do so here for our more quantitatively-inclined readers to peruse.
Table C. Predictors of rate of profit changes for the US private sector for the years 1960-2017.
| Predictors | Bivariate Model | Full Model |
| Rate of Profit (t-1) | 0.8775*** | 0.0209 |
| US Defense Spending | -0.0001 | 0.0008** |
| Organic Composition of Capital | -0.01338*** | |
| Rate of Exploitation | 0.2374*** | |
| Rate of Accumulation | 0.0007 | |
| Foreign Trade to GDP | -0.0418*** | |
| Financial Assets to GDP | -0.0032*** | |
| Government Spending to GDP | -0.0103 | |
| Prob > F | 0.0000 | 0.0000 |
| Number of Observations | 57 | 54 |
Robust regression coefficients shown. * p < 0.05. ** p < 0.01. *** p < 0.001. More stars indicate greater statistical significance.
The results of robust regression on Table C can be summarized thusly: for the bivariate model, the relationship between the rate of profit and US defense spending appears non-significant, but since the rate of profit is positively correlated with itself in the previous year, it is likely the effect of US defense spending on the rate of profit is being subsumed into the autocorrelation; for the full model, every billion dollar increase in US defense spending causes the rate of profit to rise by 0.0008 of a percent, on average, all else being the same.
30 International Communist Tendency (ICT), “The National Question Today and the Poisonous Legacy of the Counter-revolution,” published in Revolutionary Perspectives issue no. 55.
31 Rosa Luxemburg, “The Junius Pamphlet”, in The Rosa Luxemburg Reader, eds. Peter Hudis and Kevin B. Anderson (New York: Monthly Review Press, 2004), 321.
32 Karl Marx, Critique of Hegel’s Philosophy of Right (Cambridge: Cambridge University Press, 1970), 141.
